Who posted the top test results at the PRZ Arkansas Combine?

In this article:
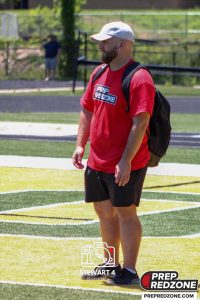
The Prep Redzone Combine Series ventured to Arkansas on May 11th, and athletes from all throughout Arkansas came through to showcase their skills. As a part of any Prep Redzone showcase event, prospects competed in testing drills, one-on-one competitions, and…

Access all of Prep Redzone
Continue reading this article and more.
Continue ReadingThe Prep Redzone Combine Series ventured to Arkansas on May 11th, and athletes from all throughout Arkansas came through to showcase their skills. As a part of any Prep Redzone showcase event, prospects competed in testing drills, one-on-one competitions, and more. Thanks to our partners at Tracking Football, we are able to give perspective on how some of the athletes test scores compare to past athletes and athletes nationwide using Tracking Football’s com score.
How does the Tracking Football Com Score work?
COM is an objective Division I Football calibrated score that includes high school only player position, height, weight, and verified combine performance data. The combine performance data includes the 40 (speed), shuttle/3-Cone (agility), and vertical/broad jump (power). Together, these data points provide a foundation to score and compare with other Division I players at the same position(s). This approach provides a method of consistent data aggregation and player comparison. The score is mathematically leveraged against Tracking Football’s college database of over 75,000 current and former Division I Football players. Over 80 FBS programs currently use the COM score in their prospect evaluation process.
TOP TEST RESULTS
Below is the list of prospects that earned the top test results at our Prep Redzone Arkansas Combine according to Tracking Football’s combine score.
| Name | Primary Position | State | Graduating Class | Top Metric | 2nd Metric |
| Brantlee Phillips | QB | Arkansas | 2026 | Broad Jump – 99% | Height – 98% |
| Isaiah Arrington | WR | Arkansas | 2025 | 40 YD Dash – 98% | Broad Jump – 92% |
| Nygel Farsee | DL | Arkansas | 2026 | Broad Jump – 91% | Weight – 88% |
| Savion Slater | LB | Arkansas | 2025 | Height – 99% | Broad Jump – 98% |
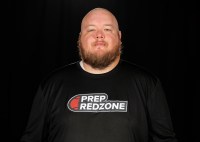
| Noah Wendel | DL | Arkansas | 2026 | Broad Jump – 95% | 40 YD Dash – 71% |
| Parker Nix | QB | Arkansas | 2026 | Broad Jump – 100% | 40 YD Dash – 88% |
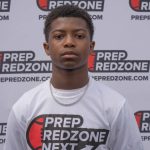
| Caden Crawford | RB | Arkansas | 2027 | 40 YD Dash – 76% | Broad Jump – 75% |
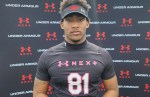
| Akin Johnson | WR | Arkansas | 2026 | Broad Jump – 100% | Height – 67% |
| Antonio Shelton Ii | LB | Arkansas | 2026 | Broad Jump – 100% | Shuttle – 82% |
How to interpret the results?
Best Uses
- Compare current prospects to former players
- Determining players’ raw athleticism
- On-campus testing evaluation
- Football speed and power signal
- National scale athletic talent discovery
- Non-Division I athletic talent discovery
- Transfer Portal evaluation
- Improved context of testing data
Advantages
- “Verified” measurements
- Mathematically tested
- Widely used score (80+ FBS)
- Large database foundation
- Contextualized for every team
- Speed, power, and agility metrics
Limitations
- Not a replacement for scouting
- Does not include in-game speed data
- Does not include track data
- Testing methodology variation
 Brantlee
Phillips
6'4" | 190 lbs | QB
Mountain Home | 2026
State
AR
Isaiah Arrington
Isaiah
Arrington
5'11" | 170 lbs | WR
Greenwood | 2025
State
AR
Nygel Farsee
Brantlee
Phillips
6'4" | 190 lbs | QB
Mountain Home | 2026
State
AR
Isaiah Arrington
Isaiah
Arrington
5'11" | 170 lbs | WR
Greenwood | 2025
State
AR
Nygel Farsee
 Nygel
Farsee
AR
Savion Slater
Savion
Slater
6'4" | 190 lbs | LB
White Hall | 2025
State
AR
Noah Wendel
Noah
Wendel
6'2" | 225 lbs | DL
Valley View | 2026
State
AR
Parker Nix
Nygel
Farsee
AR
Savion Slater
Savion
Slater
6'4" | 190 lbs | LB
White Hall | 2025
State
AR
Noah Wendel
Noah
Wendel
6'2" | 225 lbs | DL
Valley View | 2026
State
AR
Parker Nix
 Parker
Nix
6'2" | 180 lbs | QB
Rogers | 2026
State
AR
Caden Crawford
Caden
Crawford
6'0" | 180 lbs | ATH
Cross County | 2027
State
AR
Akin Johnson
Akin
Johnson
6'1" | 155 lbs | WR
Farmington | 2026
State
AR
Antonio Shelton II
Antonio
Shelton II
6'0" | 185 lbs | LB
Benton Panthers | 2026
State
AR
Parker
Nix
6'2" | 180 lbs | QB
Rogers | 2026
State
AR
Caden Crawford
Caden
Crawford
6'0" | 180 lbs | ATH
Cross County | 2027
State
AR
Akin Johnson
Akin
Johnson
6'1" | 155 lbs | WR
Farmington | 2026
State
AR
Antonio Shelton II
Antonio
Shelton II
6'0" | 185 lbs | LB
Benton Panthers | 2026
State
AR